
Strange Post-Pro Results with Quadratic Mesh
- Tiago Lira
- Topic Author
- Offline
- New Member
-

Less
More
- Posts: 3
- Thank you received: 0
13 years 8 months ago - 13 years 8 months ago #6435
by Tiago Lira
Strange Post-Pro Results with Quadratic Mesh was created by Tiago Lira
Hello all, I`m starting to use Salome-Meca now and I could use some help now.
I`m trying to plot Von Mises stresses across a piece, but whenever I plot the results obtained from a quadratic tetrahedral mesh, I get a really odd results, from negative Von Mises stresses to strange patterns on the stress map. There is a picture for linear and quadratic results attached. Now I`m not arguing about the numerical differences, since linear and quadratic elements behave different, linear being more stiff, I`m trying to understand the low stress spaces between elements, making the results very ugly on quadratic meshes. Also, I`d like to know why is Von Mises stress negative on some parts. Since Von Mises Stress is the root of the sum of square stresses acting on a point [(Stress1²+Stress2²+...+StressN²)^(1/2)], I can`t see how they can have a negative value, unless they have a complex component.
I've tried Salome 6.3, 6.5 and now 5.1.5, all of them have the same output, that is, the strange stress map while using quadratic meshes
Can someone help me?
Last edit: 13 years 8 months ago by Tiago Lira.
- Claus
-

- Offline
- Moderator
-

Less
More
- Posts: 670
- Thank you received: 34
13 years 8 months ago #6436
by Claus
Code_Aster release : STA11.4 on OpenSUSE 12.3 64 bits - EDF/Intel version
Replied by Claus on topic Re: Strange Post-Pro Results with Quadratic Mesh
It happens because you plot the results on the nodes. Values are extrapolated from the gauss points, and as such, you will get negative values. Plotting the values on the gauss points will give you a much more accurate result, provided the simulation i realistic of course.
/C
/C
Code_Aster release : STA11.4 on OpenSUSE 12.3 64 bits - EDF/Intel version
- Tiago Lira
- Topic Author
- Offline
- New Member
-
Less
More
- Posts: 3
- Thank you received: 0
13 years 8 months ago #6437
by Tiago Lira
Replied by Tiago Lira on topic Re: Strange Post-Pro Results with Quadratic Mesh
claws, thanks for replying!
I've read that I should use ELGA results rather than NOEU, and the plot looks very nice with ELGA, good transitions and such. But I still don't understand how a extrapolation on nodes between 2 positive values can result on a negative value. Isn't that a problem with the way Salome-Meca interprets the results? It doesn't seem right at all.
Thanks for your answer!
- kwou
-

- Offline
- Moderator
-
13 years 8 months ago #6438
by kwou
Interest: structural mechanics, solar energy (picture at 'my location' shows too little pv panels)
--
kind regards - kees
Replied by kwou on topic Re: Strange Post-Pro Results with Quadratic Mesh
Hoi MC,
But I still don't understand how a extrapolation on nodes between 2 positive values can result on a negative value
Nodes are normally at the outer edge of an element, gauss points are inside the element.
So if the slope of the von Mises stress is large enough between the gauss, you will get negative results at some point outside the gauss points, eg on the nodal points.
Extrapolation always need to be interpreted with care.
Interest: structural mechanics, solar energy (picture at 'my location' shows too little pv panels)
--
kind regards - kees
- Tiago Lira
- Topic Author
- Offline
- New Member
-
Less
More
- Posts: 3
- Thank you received: 0
13 years 8 months ago #6439
by Tiago Lira
Replied by Tiago Lira on topic Re: Strange Post-Pro Results with Quadratic Mesh
keeswouters, thanks for your reply!
I sincerely still can't understand how the software can interpret a negative stress values between 2 positively loaded elements/nodes. But since ELGA plots seem more reliable on that, I'll use them instead of ELNO. Still, that should be looked on.
Thanks for your help, it was much appreciated!
I sincerely still can't understand how the software can interpret a negative stress values between 2 positively loaded elements/nodes. But since ELGA plots seem more reliable on that, I'll use them instead of ELNO. Still, that should be looked on.
Thanks for your help, it was much appreciated!
- kwou
-
- Offline
- Moderator
-
13 years 8 months ago - 13 years 8 months ago #6440
by kwou
Interest: structural mechanics, solar energy (picture at 'my location' shows too little pv panels)
--
kind regards - kees
Replied by kwou on topic Re: Strange Post-Pro Results with Quadratic Mesh
hoi MC
Another try. With pictures.
A rectangle with nodes [x,y] = 1,1,-1,-1], [1 -1, -1,1
Gauss points at nodes [x,y] = 0.5,0.5,-0.5,-0.5], [0.5 -0.5, -0.5,0.5
Values at gauss points S = Z = [3,4,1,2]
See pictures below (different views for each of them, last two along x and y axes).
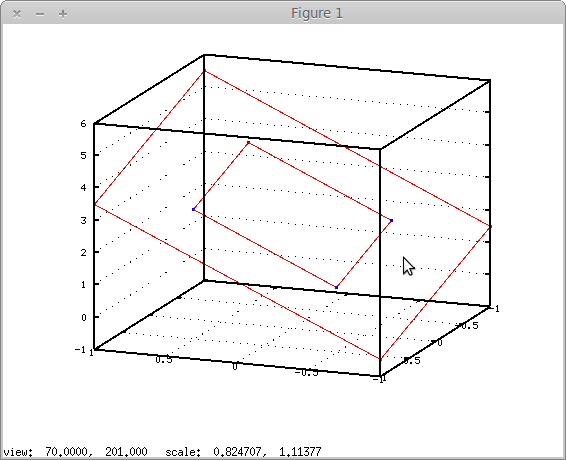
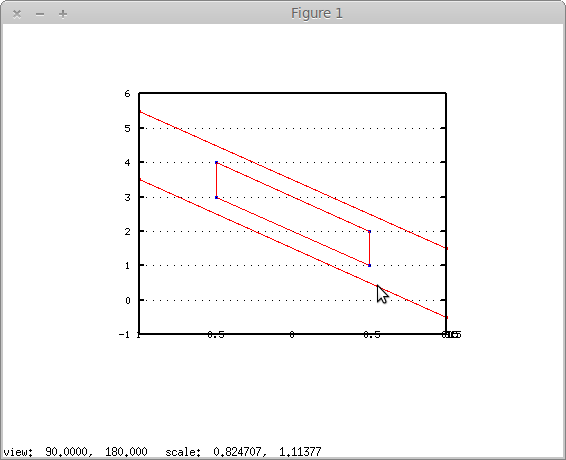
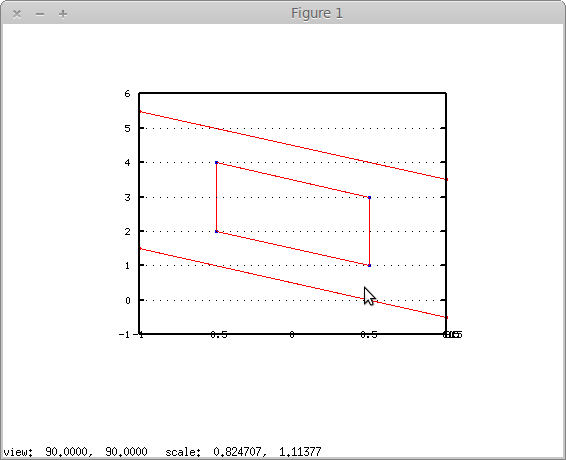
the inner rectangle denotes the values on the gauss point (at x,y = +/- 0.5).
The outer rectangle denotes the extrapolated values (x,y = +/- 1.0).
At [x,y] = [-1,-1] the value for S is negative (-0.5).
Hope this is helpfull.
--> In gauss.zip a matlab/octave program for plotting the pictures above is given.
Another try. With pictures.
A rectangle with nodes [x,y] = 1,1,-1,-1], [1 -1, -1,1
Gauss points at nodes [x,y] = 0.5,0.5,-0.5,-0.5], [0.5 -0.5, -0.5,0.5
Values at gauss points S = Z = [3,4,1,2]
See pictures below (different views for each of them, last two along x and y axes).
the inner rectangle denotes the values on the gauss point (at x,y = +/- 0.5).
The outer rectangle denotes the extrapolated values (x,y = +/- 1.0).
At [x,y] = [-1,-1] the value for S is negative (-0.5).
Hope this is helpfull.
--> In gauss.zip a matlab/octave program for plotting the pictures above is given.
Interest: structural mechanics, solar energy (picture at 'my location' shows too little pv panels)
--
kind regards - kees
Last edit: 13 years 8 months ago by kwou.
Moderators: catux
Time to create page: 0.163 seconds